

The Flex Barbell Sensor
The Flex Barbell Sensor was reviewed previously and I went through what is “in the box”, the setup process and some of the useful features of the sensor + Flex Stronger app. They include 1RM testing and getting real-time feedback (audio or visual) of every repetition so I know I am hitting my goals (or not) for the session. In case you haven’t seen it, do check it out: Flex (Barbell) Sensor Review – Our 1st Look.
Data Data Data
Here in this post, I take a look at the data of the Flex sensor and how accurate it is. I had the opportunity to test it with a Gymaware unit and 2 different IMUs at different occasions. I also came across a paper recently published on the Journal of Strength & Conditioning Research where the authors completed a validation study of the Flex sensor and compared it using a top end motion capture system and a purpose built rig. The results (from the paper) showed that the Flex is pretty accurate in determining average velocity for the two exercises performed in the study (back squat and bench press). More of everything below.
Comparison With Other Devices
GymAware
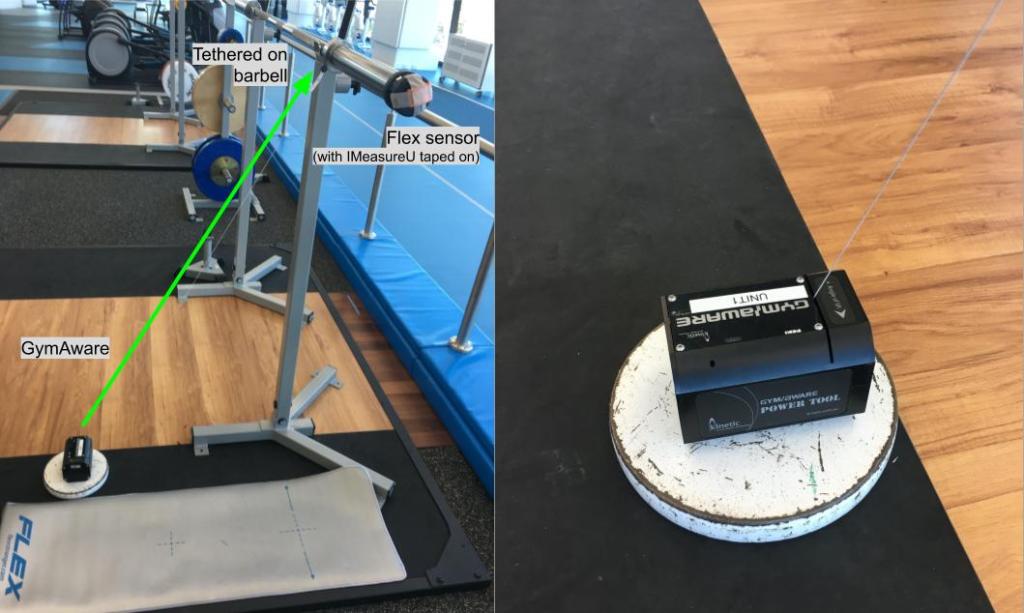
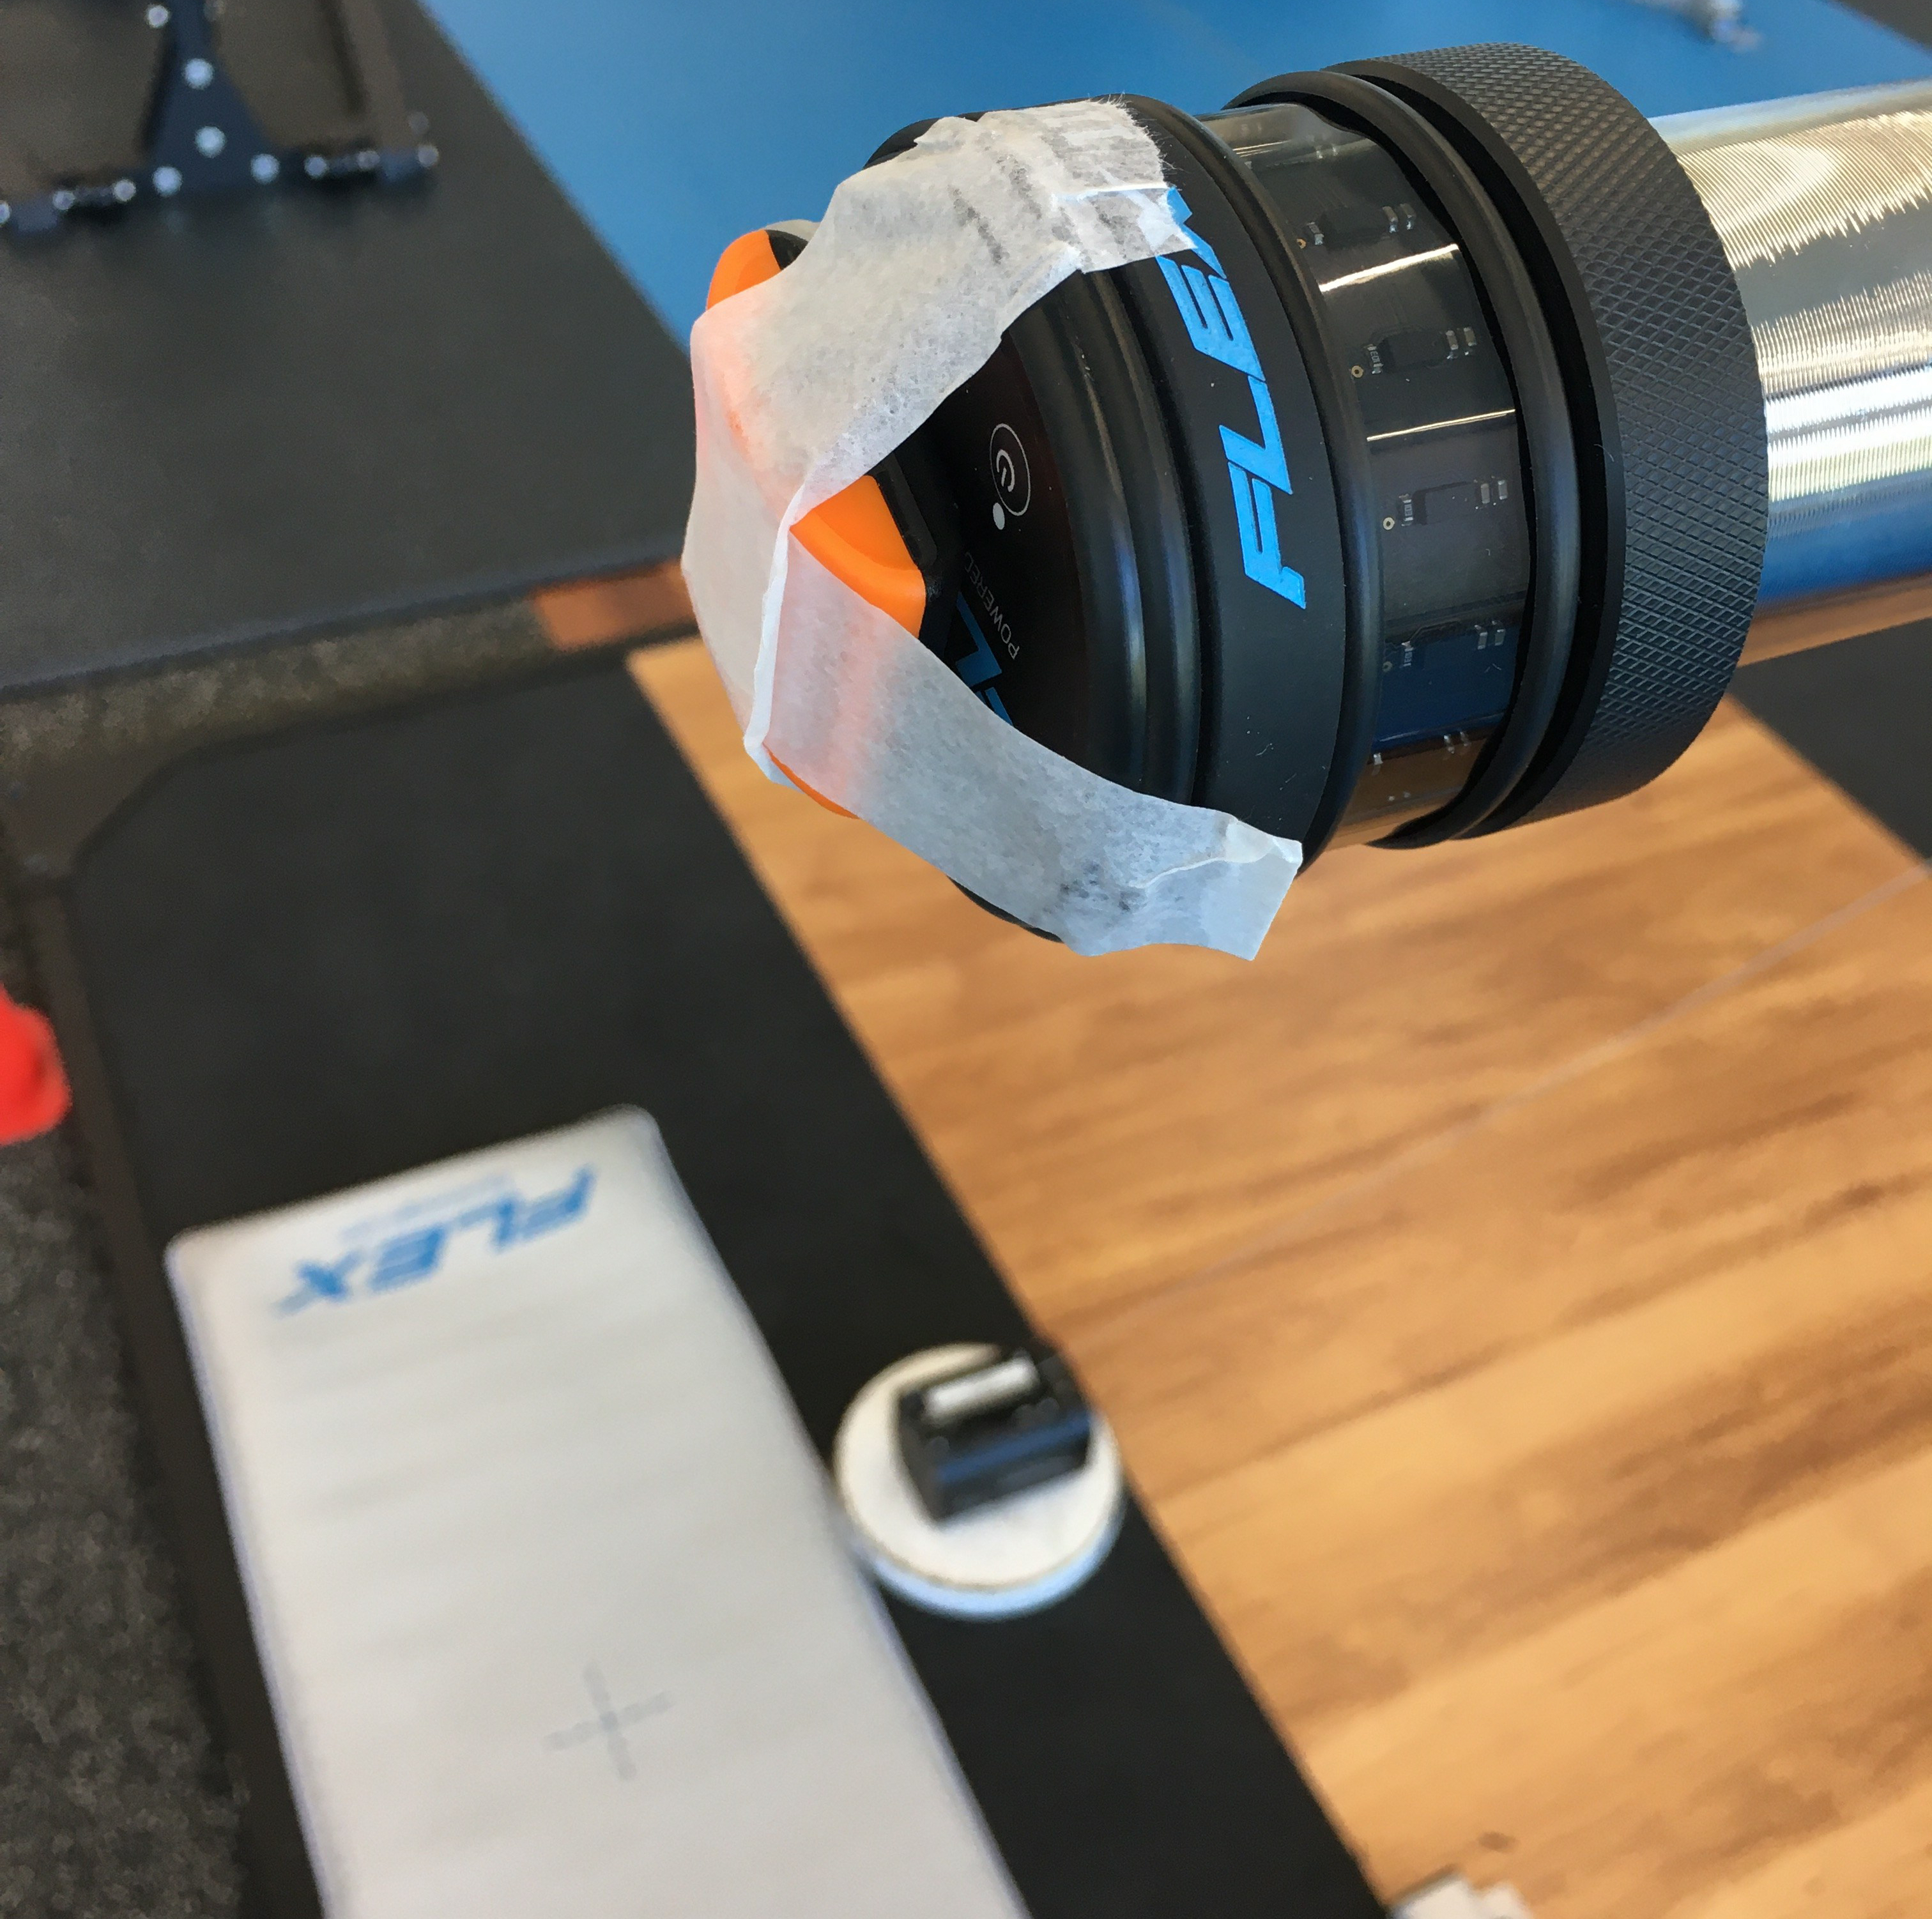
I ran a test using a GymAware unit tethered on the same side as the Flex sensor. I also taped an IMeasureU IMU on the Flex sensor to capture acceleration data which I will get to later on. I had a couple of researchers kindly performed a few sets of back squats and snatches. Unfortunately, I forgot to save the data from the GymAware so I can’t show any of that here. Generally the measurements looked consistent (the movement/position data) although the average velocity values captured on the Flex were lower than the GymAware values. There were also a couple of errors or bugs that I caught depending on how you see it. (Note: I probably won’t notice them if I didn’t have something to compare with)
Errors/Bugs
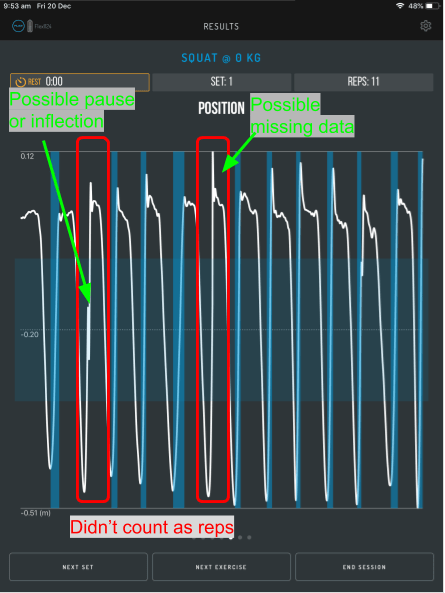
In a set of back squats, two reps were not counted by the Flex sensor. Feedback from the Flex team was that a pause (that was longer) on the first uncounted rep and a few missing data points on the second uncounted rep are the likely culprit for the missed counts. The missing data points could potentially be a case of misalignment with the mat. When I look at the Position data plot (shown below), I can see that there is a mid-way inflection (in the first uncounted rep) and an unusual top spike (in the secound uncounted rep) that might have messed with their algorithm. [Note: the parts of the Position data plot which are shaded blue are the ones that have been identified as a rep]
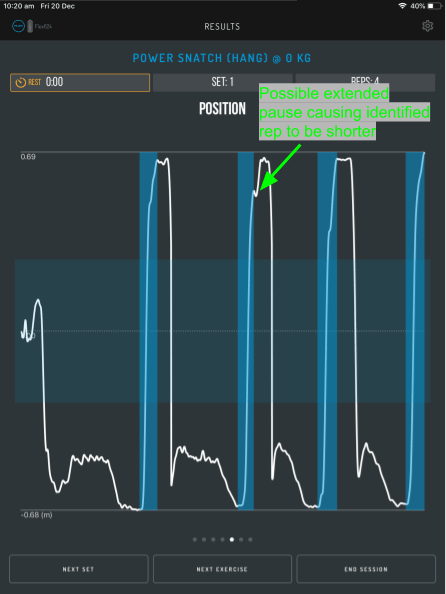
Also, in a power snatch exercise, the second rep (as shown in the Position data plot below) could have an erroneous measure of its velocity and distance due to a slightly longer pause during the end phase of the snatch.
So a few key takeaways from this part is:
- Make sure movements are as smooth as possible without too long a pause during each rep so that there is less chance of errors
- Make sure that the Flex sensor is aligned to the reflective mat during the entire period of the exercise to reduce any chance of missed data points.
- I did miss an app update when I ran this session; so it is possible that the errors I saw may have been fixed with the update.
- While all that was happening with the Flex, the GymAware didn’t miss a beat with the measures which goes to show it is built more reliable; and since the Flex is basically developed by the same team (Kinetic Performance), it gives me some confidence that any bugs or errors will be addressed.
IMeasureU
In the same session as above, an IMeasureU sensor was taped to the Flex sensor and the inertial sensor data were recorded for the same squats and snatches that were captured by the Flex. First of all, here’s a quick comparison of the data the IMeasureU sensor measures and what the Flex sensor measures:
| Flex | IMeasureU | |
| Sensor type | Laser | Accelerometer (just focusing on this here) |
| Data captured | Position/Distance | Acceleration |
| Additional data calculated | Velocity | Velocity |
| Sampling rate | 50Hz | 100Hz |
So the Flex sensor measures its position data relative to the reflective mat and differentiating position data gives us velocity. Whereas with IMeasureU’s accelerometer, we get acceleration data and integrating acceleration gives us velocity. Comparing the two, differentiating from position to velocity is definitely easier and more straightforward. Plus IMU (accelerometer) data can include noise (and drift) and requires a fair amount of post processing and filtering before we get to velocity data.
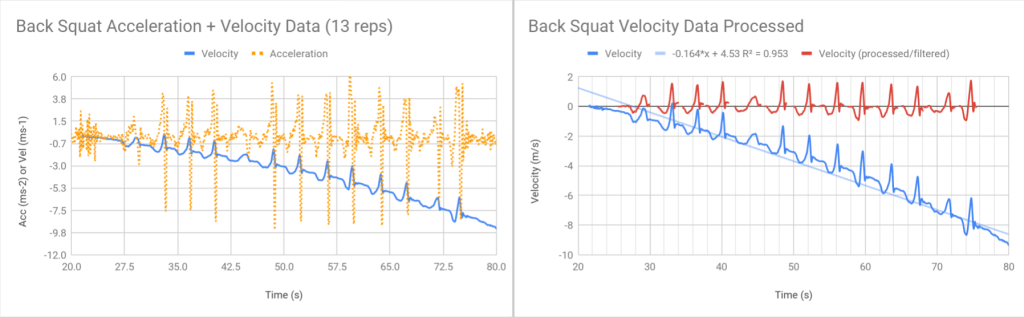
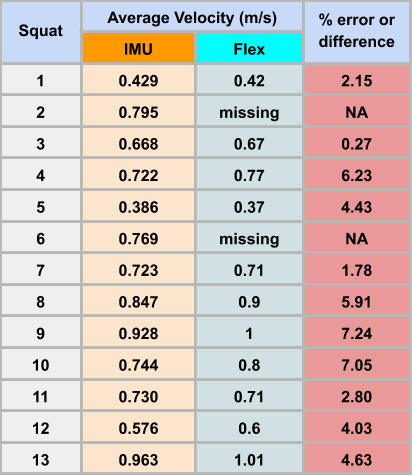
As we can see the above graphs (on the left), if we take the acceleration data and integrate it directly to get velocity, the velocity data is going to be skewed. But with some simple filtering and processing, the velocity values will look much more normal (above right). Still the data we get from the IMU is not quite close to what Flex measured. I definitely lean towards my processing of the IMU data not being 100%. So we can see between 0.27 – 7.24 % difference (or an average of 4.23% ) from the table below.
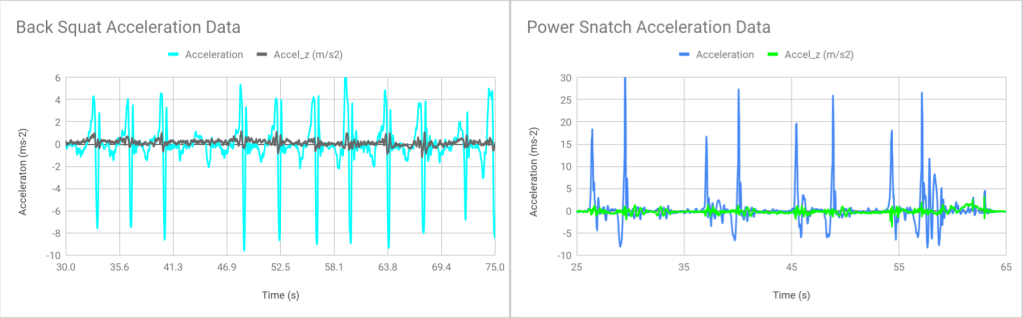
On the other hand, besides the hassle of processing raw data, an IMU with a 3-axis accelerometer (which is pretty standard these days) can provide additional information such as tilt or balance and sideway movements of the bar. In this case, if we look at the Z-axis acceleration (Accel_Z), we can see that there were some tiny sideway movements.
MetaMotion
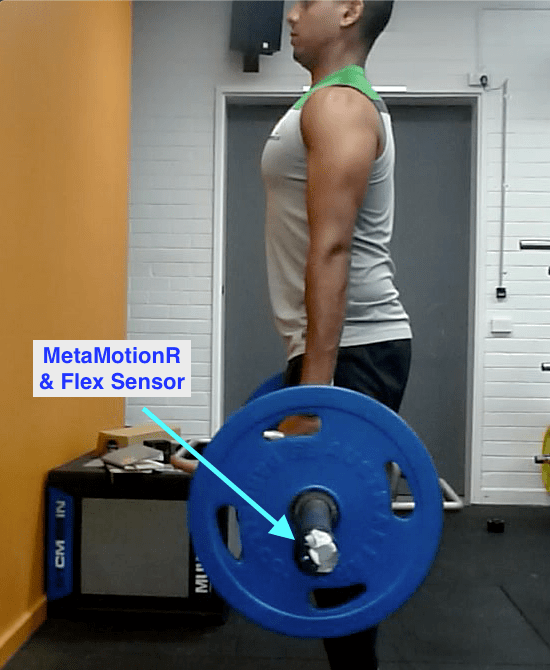
On another session, I used a MetaMotion R IMU sensor instead and I compared its data for the Trapbar Deadlift exercise with the Flex. Similar to the IMeasureU IMU, the MetaMotion was taped onto the Flex sensor which was attached to the end of a trapbar and the MetaMotion was sampling acceleration data at 100Hz. Trying to calculate the average velocity for each rep (the concentric component) proved to be a bit more challenging than squats and it took me a couple more steps to try and get it right. I also had to refer to the video (which is shared in my previous post) to confirm what I was seeing in the data. In the end, my post processing still didn’t get the results I was most happy with but I got my geek fix of looking at data and plotting colourful graphs.
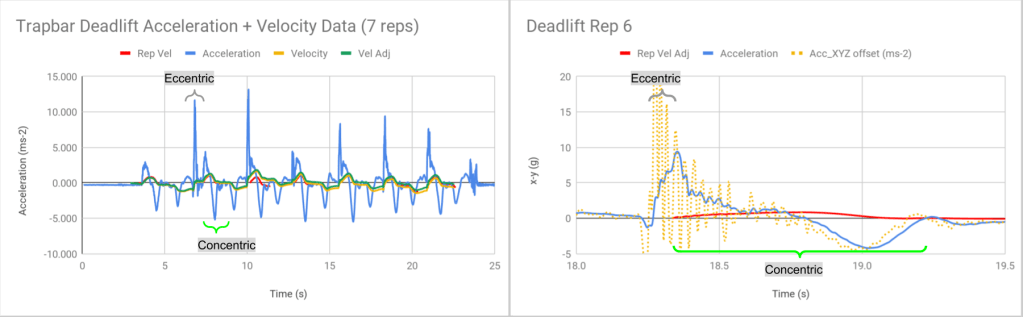
My takeaway from testing with the IMUs (IMeasureU and MetaMotion) are:
- Processing IMU data to measure what Flex does is not very straightforward and possibly not very accurate because IMU data can drift.
- There are fusion algorithms available that will make IMU data a lot more usable; and I am sure the IMU products out there for Velocity Based Training have much better real-time processing and filtering than what I have done with post processing in a spreadsheet.
- But as I mentioned earlier, differentiating position data to determine velocity is still a lot more straightforward assuming the position data is accurate.
So next, I look at a few main points of the paper I mentioned at the start.
Flex Sensor Research Validation
The title of the paper is “Criterion Validity, and Interunit and Between-Day Reliability of the FLEX for Measuring Barbell Velocity During Commonly Used Resistance Training Exercises”. There were four things that the study aimed to achieve: 1) establishing criterion validity, 2) assessing interunit reliability, 3) quantifying interunit reliability 4) assessing between-day reliability. That’s a lot of “reliability” in there. Basically a top end Vicon system was used to compare the velocity measures of the Flex sensor; or to be a bit more precise, 12 high speed cameras were set up to measure the movement of the Flex sensor while athletes performed back squats and bench presses.

Using the Vicon velocity measure as the gold standard benchmark, the typical errors of the Flex measures were less than 0.05ms-1, which is really good. Those measures were done with the athletes lifting with different percentages of their 1RM (20%, 40%, 60%, 80% & 90%) which means a range of different velocities.
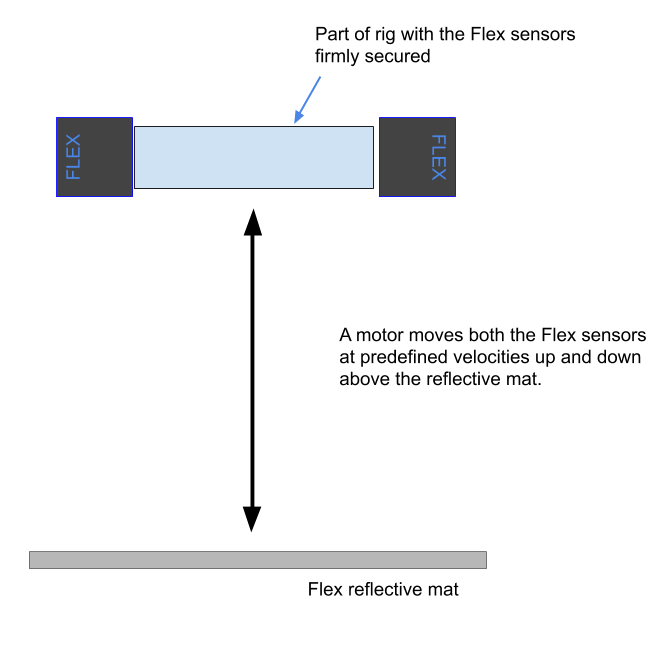
In another part of the study, the authors compared the measures between 2 Flex sensors on a calibrated rig (to test Interunit reliability). The calibrated rig had a bar with one Flex sensor attached on each end and the entire bar was displaced vertically by a motor so that the Flex sensors were moved up and down over a reflective mat. Again, the typical errors were very low and the coefficient of variation (CV) was < 5%. Even when the same test was done with athletes, adding “biological variation” to the testing, the coefficient of variation was < 10%, which is still considered very good.
So the main takeaways from this paper are:
- The Flex sensor is an accurate and reliable device for measuring average velocity of the barbell during strength training, particularly for back squats and bench presses. (Which the authors of the paper recognise as a limitation of the study)
- If there are two athletes training with different Flex sensors, their results can be used for comparison. Even if they swap sensors, it shouldn’t be of too much concern. Although it is recommended that if an athlete typically places the Flex sensor on their right side of the barbell, they should keep that consistent.
Again, for anyone who is interested in the paper, you can find it here: link.
Lastly
I wanted to add that with the recent Flex stronger iOS app update (ver 1.8), there are a few interesting features that are related and worth noting:
Exporting to CSV
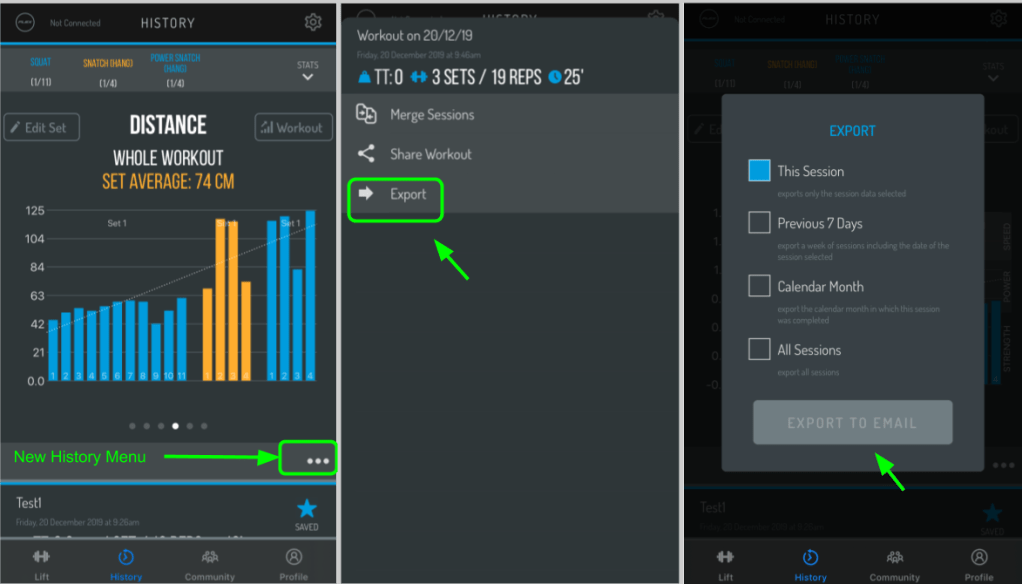
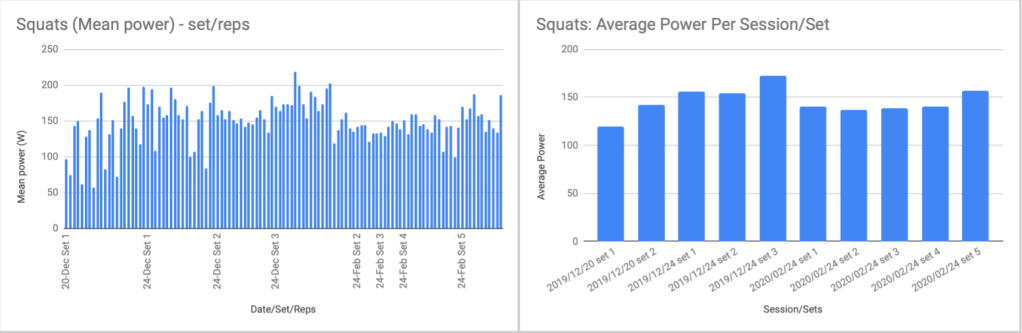
In the History section, for each of the past workouts, we now have the option to export that data in CSV format. At the bottom of each workout in History, there’s a menu option (3 dots) on the right. Selecting that gives us the options to ‘Merge Sessions’, ‘Share Workout’ or ‘Export’. When we choose ‘Export’, we can either export the selected session, previous 7 days, sessions in the calendar month or all the sessions. Clicking on ‘Export To Email’, a link was sent to my email where I could download the CSV file. The CSV file contains the exact same data as what is shown on the interface but we can now rearrange them in the way we want and analyse it further within a spreadsheet (for e.g. looking at just the squats data for the last few months). Or that CSV file can be forwarded to a coach to be analysed.
Video Recording With Flex In The Background
Earlier I mentioned that I had to refer to a recorded video of a previous workout to understand what exactly I was seeing in the IMU data and the Flex data. I reckon this can be a common situation and having a video reference helps put things in perspective especially when a metric or number looks unusual. But to do that, I would need an additional device (besides the one running Flex) to capture video.
With the version 1.8 app update, the Flex team has allowed Flex to be running in the background while I switch to the camera app on the iPhone/iPad. This saves an athlete from having to carry multiple devices if they also wanted to have their session recorded on video. Of course it will be even cooler if the camera recording was embedded within the Flex stronger app. I should definitely raise this with the Flex team.
Peak Velocity Data In History
In case you missed it, Peak data is now visible in the History section. Just tap on the chart title and it will switch to the peak values – e.g. Velocity -> Peak Velocity, and tap again to show Velocity again. Also, all these data (average and peak values) can be found in the CSV export file too.

That is all for this post! Hope that was helpful. If there was anything you would like to find out about the Flex sensor that wasn’t mentioned, feel free to leave a comment or reach out to us here (link). Thanks for reading and until next time, stay safe!

Great review Julian. I love learning about biofeedback technology regarding speed and power training.
If you have time in the future, could you review the barsensei? They have proprietary measures that are very interesting for running and jumping, such as the POP-100ms metric that measures concentric velocity at 100ms. There are some papers out there written on some of their metrics. Would like to see you looking at it and comparing it between different IMUs.
Jackson Cheung
LikeLiked by 2 people
Hi Jackson! Thanks for the feedback and the suggestion. I will have a look into it if I have the opportunity. Cheers 👍🏼
LikeLiked by 1 person